

Boards
Discover Patterns, Drive Efficiency
Experience powerful visualization tools to analyze the vast amount of IoT data collected from various sensors throughout the building. Discover critical details about energy consumption, indoor air quality, and occupancy patterns via interactive dashboards and real-time data visualization and identify patterns and anomalies.
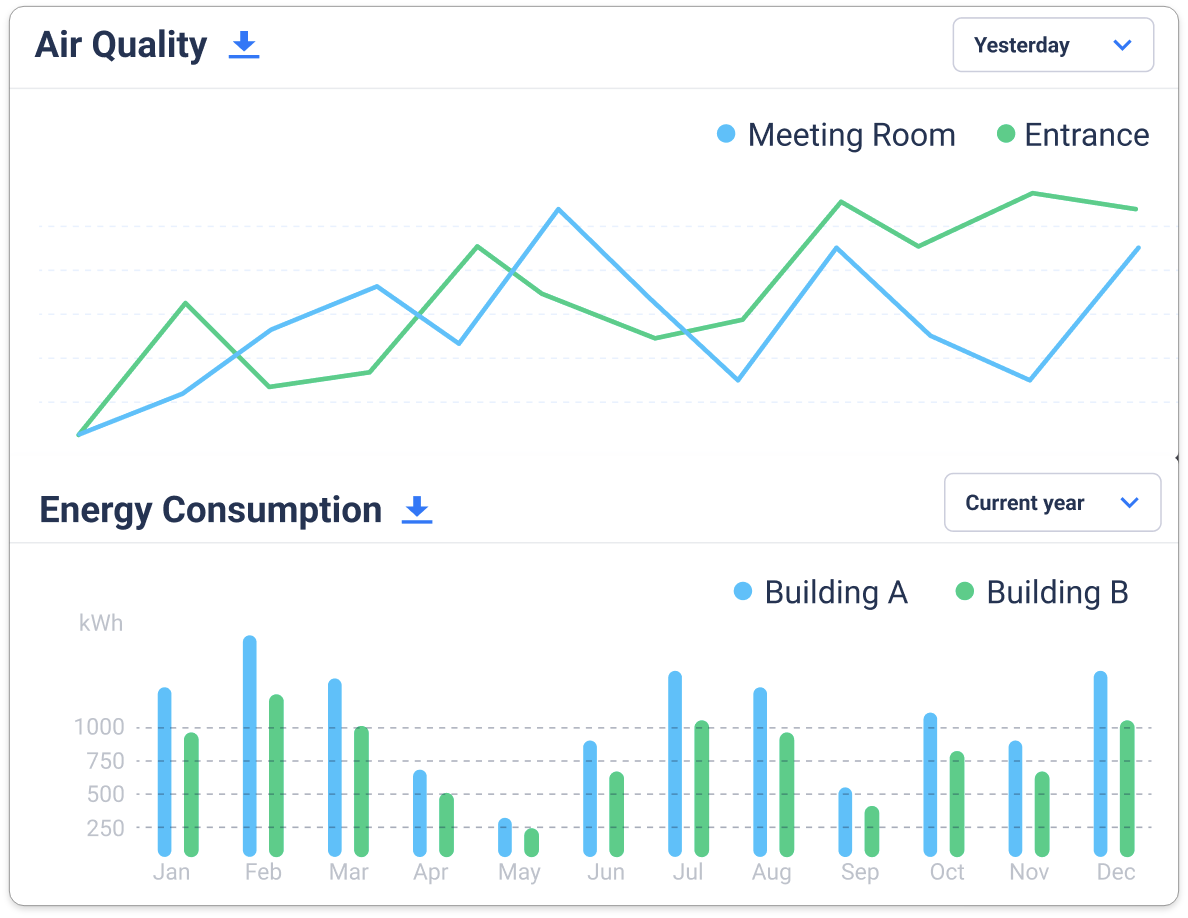
Comparative Charts
Compare and analyze data from different IoT sensors or parameters on a single chart.
New
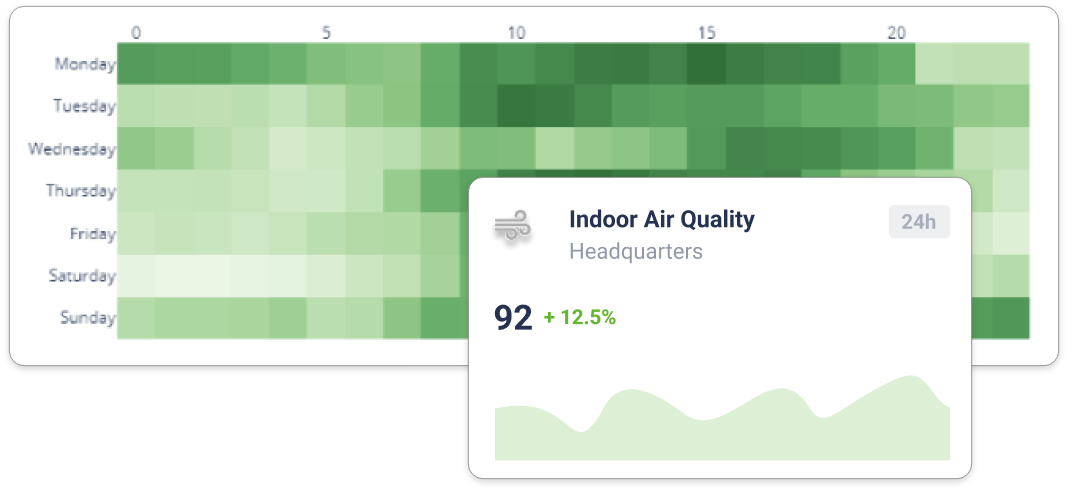
Heatmaps and Trend Analysis
Visualize data trends and patterns over time using interactive heatmaps and trend charts. Analyze various parameters and gain insights into usage patterns and identify potential areas for optimization.
Export Data
Easily export IoT sensor data into Excel format for further analysis and processing.
Real-Time Data Visualization
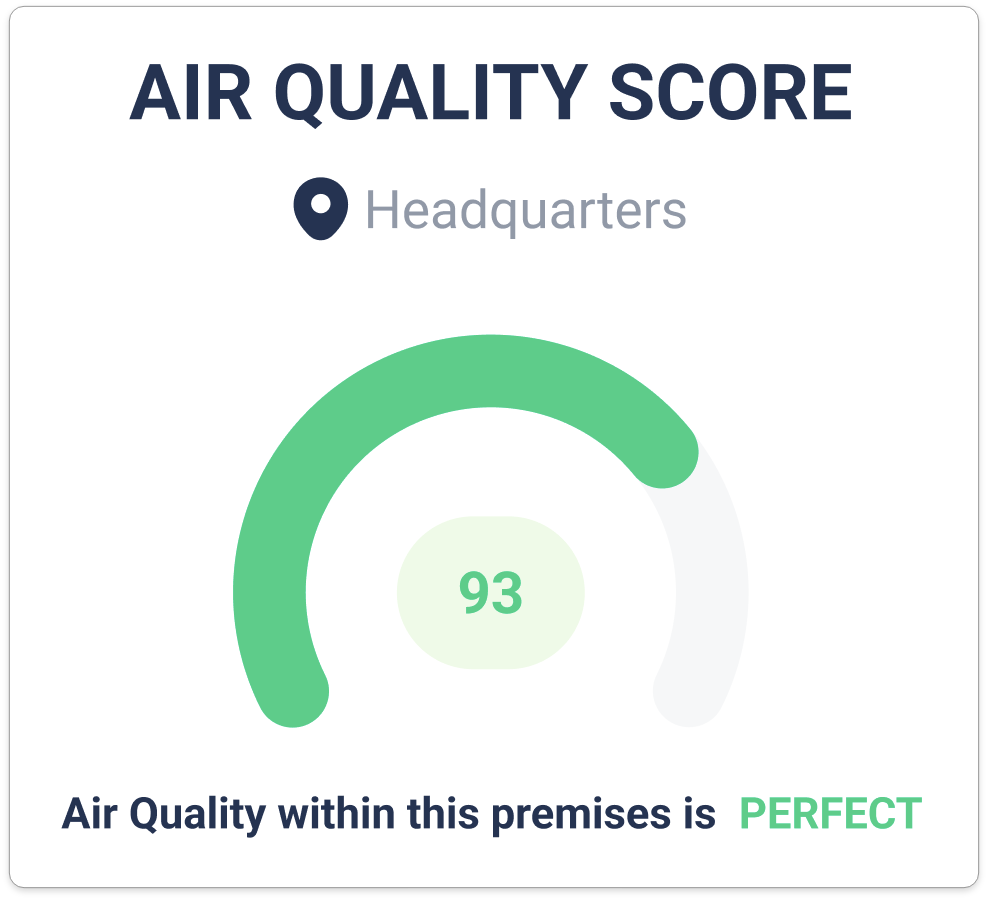
The Real-Time Data Visualization allows users to visualize live data from IoT sensors in a dynamic and interactive manner. Users can gain useful insights into various aspects of their building with real-time updates and customizable visualizations.
Let your building occupants access essential information and updates using digital displays and QR codes. Enhance communication, engagement, and awareness among occupants, and promote a more connected building environment.
EXPLORE OTHER FEATURES
Sensgreen is loaded with powerful features that makes managing a building efficient
Automation
Control your devices effortlessly
Notification Builder
Create customized and real-time notifications
Analytics
Advanced overview of building information
Device Manager
Control a wide range of IoT devices
Integrations
Make all your devices and apps work better